
Product, Engineering
Adaptive Tiering lowers the cost of keeping machine data you haven't queried recently
Adaptive Tiering moves settled event data between three tiers based on how recently it was queried, so keeping logs, traces and events for longer costs progressively less. Every tier has the same latency, and there’s no restore step or anything to configure.
Conor Curran

Engineering
Hermes agent plugin: Where did all my tokens go?
A plugin that ships Hermes agent telemetry to Axiom as OpenTelemetry, and how we built it.
Heinz Gies
Engineering, Product
Why does Splunk cost so much?
Indexed search, schema-on-read, and indexer-bound readiness made the product. They also made the meter expensive at volume.
Axiom
Engineering, Product, Company
How much does it cost to store machine data in Splunk?
Splunk's bill combines ingest volume and retention path, not a flat storage rate; here's what a 1 TB/day workload costs.
Axiom

Product, Engineering
At petabyte scale, telemetry ingestion becomes a data-centre architecture problem
Why the shaping work hiding inside "ingest" should move to where telemetry is produced.
Neil Jagdish Patel
Product, Engineering
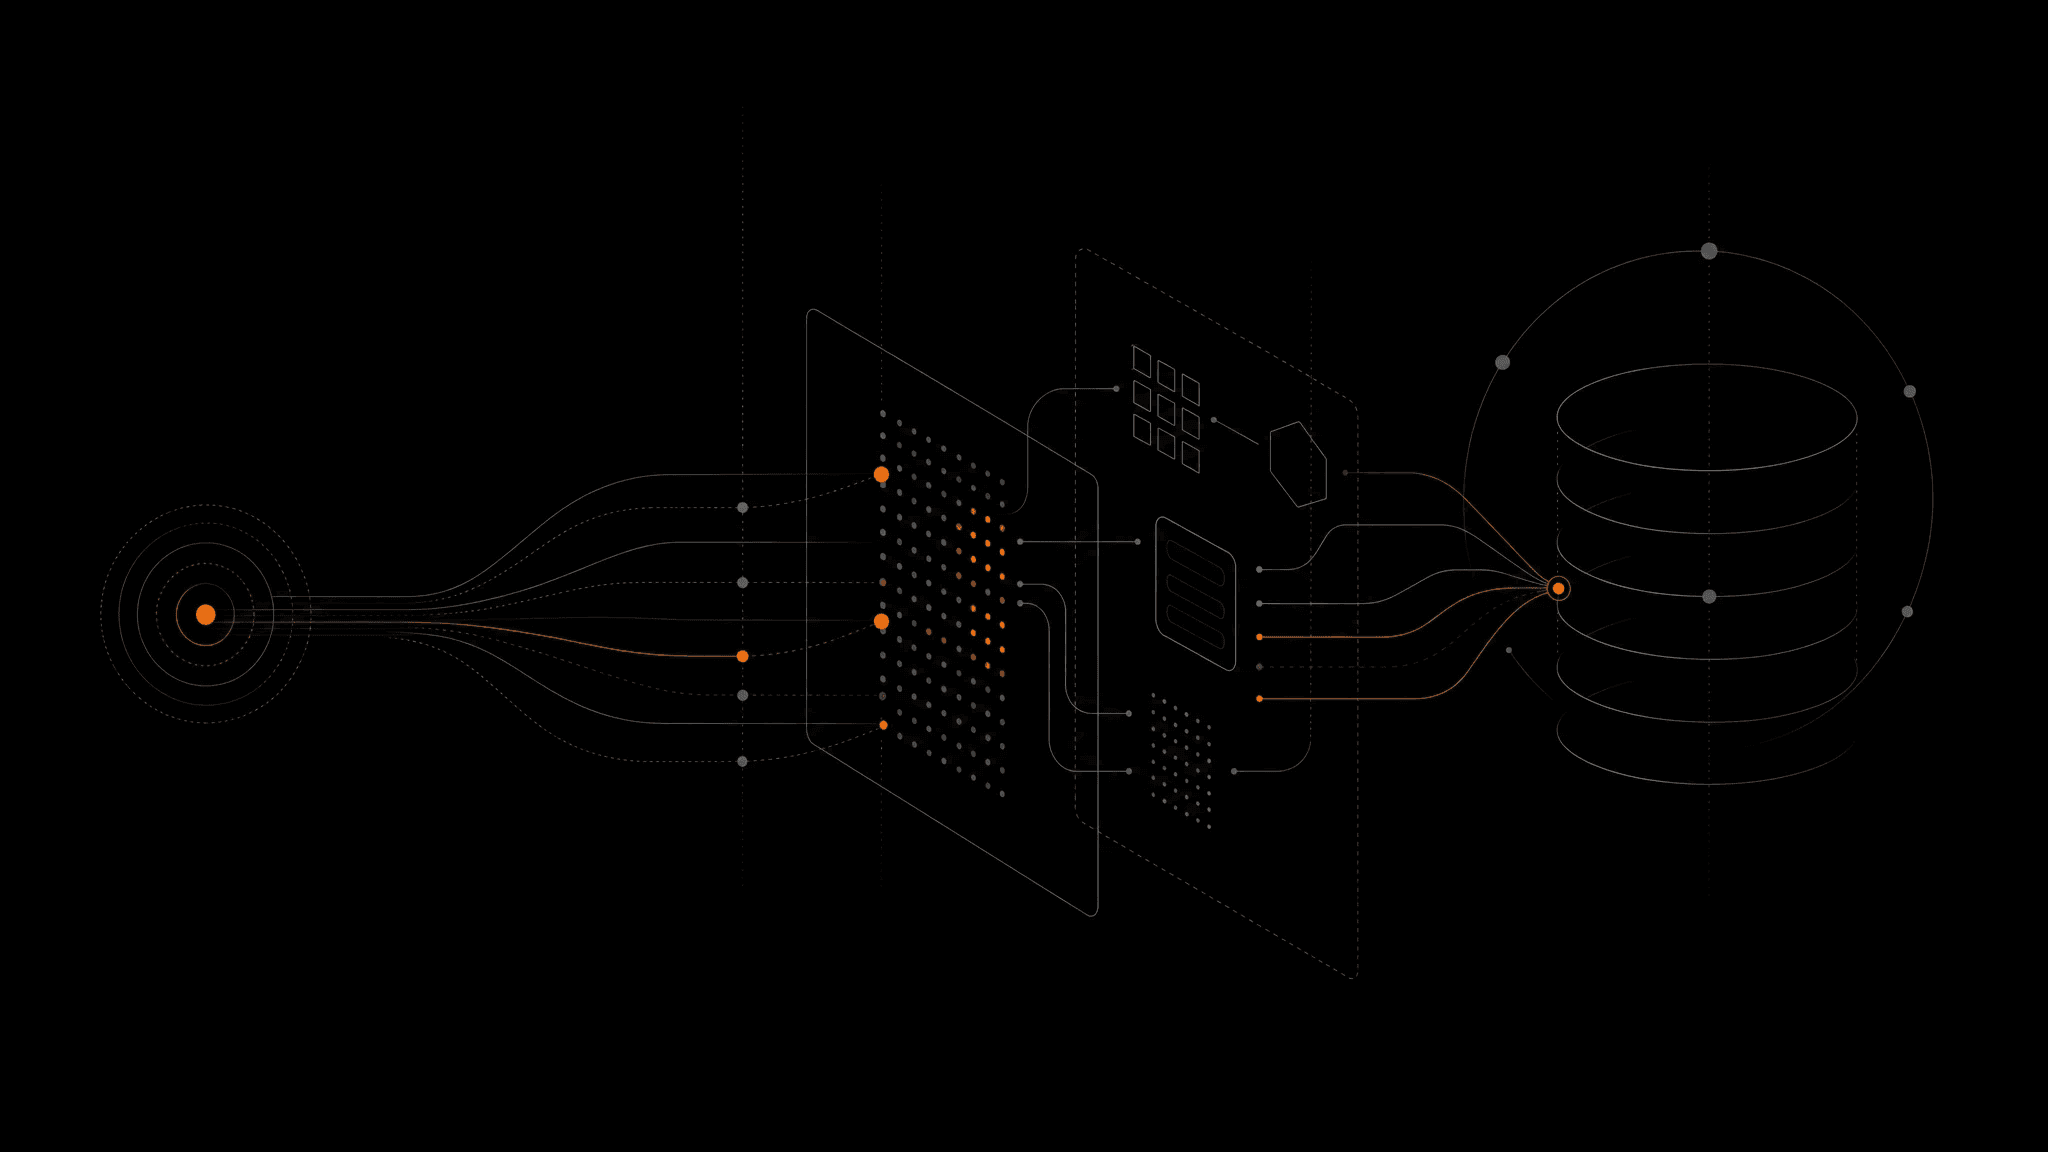
Introducing Bifrost: A new loading path for petabyte-scale OpenTelemetry
Bifrost is a new high-volume OpenTelemetry data-loading path for Axiom's machine data platform, now in private preview.
Axiom
Engineering
How many bitmaps does it take to beat a gorilla?
Why we built our own caching and storage format.
Heinz Gies

Product, Engineering
Introducing Correlations: from symptom to system state
Connect logs, traces, and metrics so investigations can move from the first clue to the surrounding system state without manual query stitching.
Christopher Ehrlich

Product, Engineering
The humble placeholder: A small documentation problem worth fixing
Axiom is simple to get started with. But there is one small, reliable stumbling point for new users: placeholder replacement in code examples. We built a small tool to fix it.
Mano Toth
Engineering
The Sortable interface: Teaching every column type to sort itself
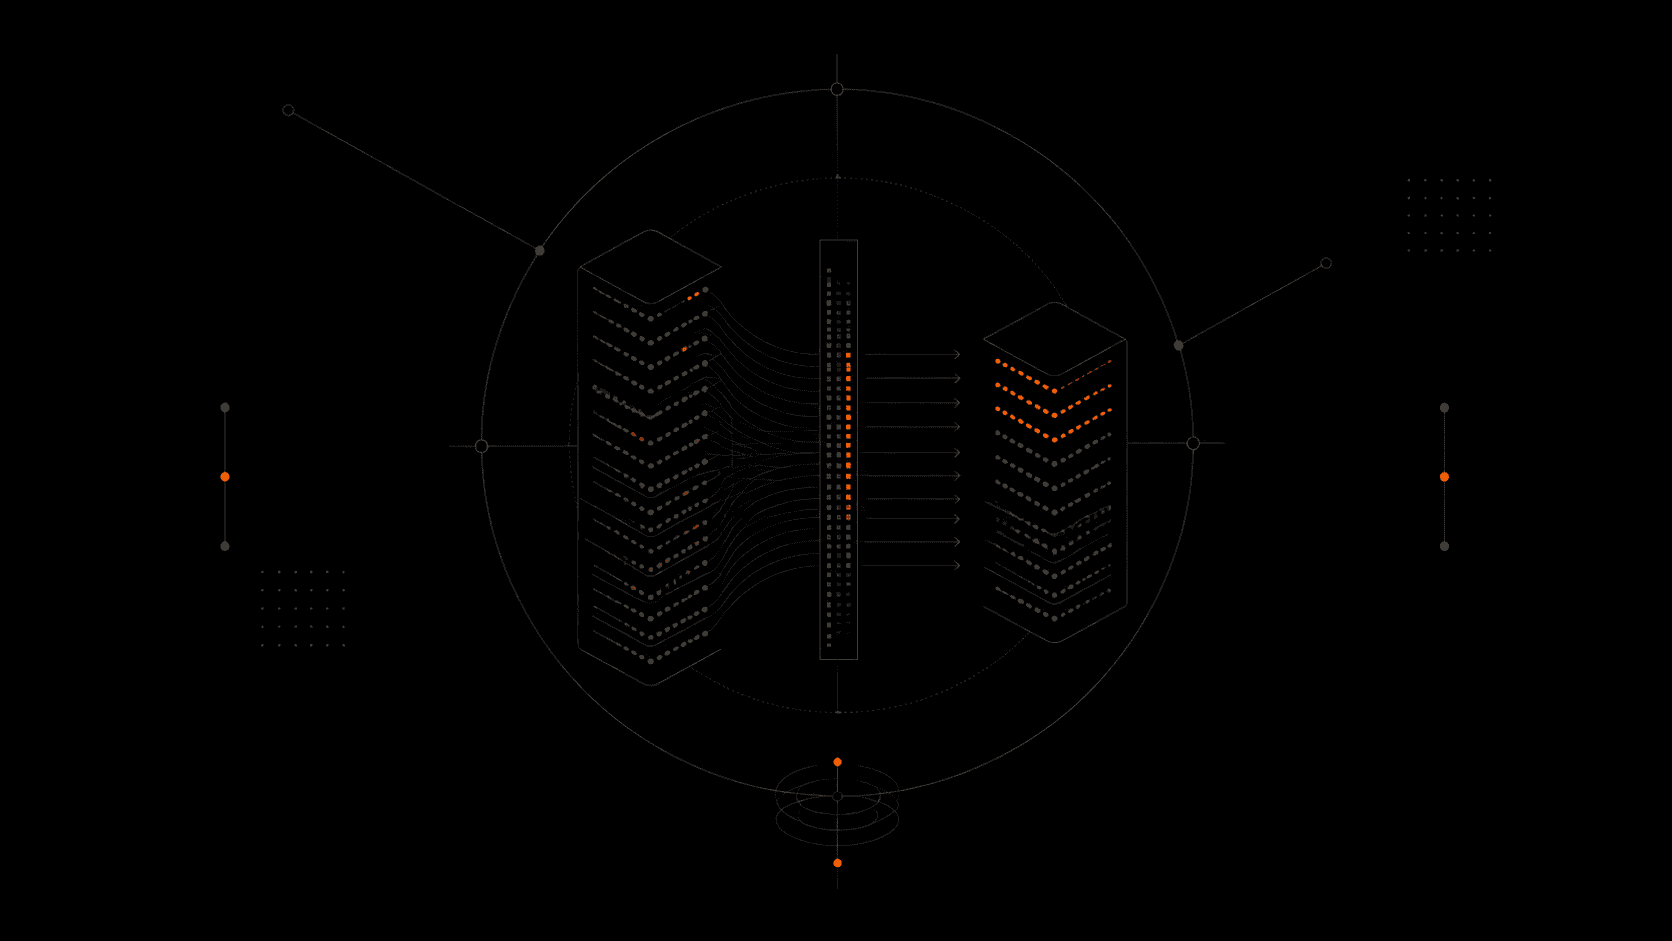
Replacing a one-size-fits-all sort with column-aware algorithms delivered speedups ranging from 2x to 26x, without changing a single query.
Hassan Ezzeldeen, Mano Toth, Tomás Senart
Metrics are generally available
Read postCatch what tests miss: Online evaluations for AI capabilities
Read postTeaching AI to speak Splunk, then proving it works
Read postClose the loop: User feedback for AI capabilities
Read postIntroducing GenAI functions: Analyze AI conversations with purpose-built APL functions
Read postStop shipping on vibes: Offline evaluations for AI capabilities
Read postIntroducing metrics: High-cardinality without the cost
Read postYour agents are only as good as their context. Give them everything with Axiom MCP
Read postUnderstand your event data in seconds with Spotlight
Read postWhat building AI features taught us about the future of observability
Read postAxiom’s new JS logging libraries: Flexible, powerful, framework-agnostic
Read postNew dashboard elements: heatmaps, pie charts, monitor lists, and notes
Read postMonitoring at Axiom
Read postIntroducing Flow: Redefining event data processing
Read postIntroducing our new documentation
Read postIntroducing Axiom Terraform Provider
Read postFreedom from limits
Read postHow to Enrich OPNsense Events with Threat Intel
Read postHow to Use Axiom with OPNsense logs
Read postOTel semantic conventions deep dive
Read postThe Right To Be Forgotten vs Audit Trail Mandates: A Tech-Law Expert’s Guidance for Log Management
Read postWhy should I even consider OTel?
Read postIt’s time to stop self-managing your log infrastructure
Read postObservability: A brilliant idea whose name has been hijacked
Read postNew Pricing: Axiom starts lower, stays lower
Read postUpgrade your Grafana experience with the Axiom data source plugin
Read postMonitoring HTTP Requests with Cloudflare Workers
Read postHow We Made the Axiom Vercel Integration Even Better
Read postMonitoring AWS Lambda with Axiom
Read postGet Deep Visibility into CloudFront Logs with Axiom
Read postVercel Integration
Read postMake Your Logstash Pipeline More Powerful with Axiom
Read postFebruary Changelog: What’s New at Axiom
Read postShipping Filesystem Metrics to Axiom
Read postNovember Changelog: What’s New at Axiom
Read postQuery Logs with Axiom CLI
Read postMonitor and Analyze Your Heroku Applications with Axiom
Read postOctober Changelog: What’s New at Axiom
Read postMonitoring using Axiom’s Data Explorer
Read postSeptember Changelog: What’s New at Axiom
Read postIntroducing Axiom Playground
Read postImproved Incident Response with Alerts from PagerDuty on Axiom
Read postObserving IBM Kubernetes service
Read postLearn how to setup Monitors and Notifiers
Read postUse Axiom and MetricBeat to better understand system performance
Read postVisualizing log events with Axiom
Read postUse Axiom and Redis for better performance monitoring
Read postGetting Sophisticated alerts from Filebeat on Axiom
Read postShipping uptime metrics to Axiom
Read postMonitoring Rancher with Axiom
Read postHow to Analyze Logstash logs on Axiom.
Read postMonitor DigitalOcean Kubernetes Service with Axiom
Read postIngress Log Data from Azure Kubernetes Service to Axiom
Read postWorking with Aggregations
Read postWorking with Dashboards in Axiom
Read postIntroducing the Axiom CLI
Read postRemote Collaboration tips: microphone
Read post